
The Electrification Productivity Puzzle
Why it took thirty years for the lights to turn on for the global economy

TL;DR: Productivity didn’t come from motors. It came from the networks—and the 30 years it took to learn how to build them safely and cheaply.
Factories started installing electric motors in the 1890s, but productivity didn’t boom until the 1920s—a puzzling 30-year delay. The standard explanation is that it took firms decades to learn how to reorganise their workflows around the new technology. But the real delay had nothing to do with slow factory learning. It was happening upstream, in professional organisations, standards bodies, and insurance company survey reports.
Between 1890 and 1920, Factory Mutual Fire Insurance Company was accumulating data from electrical fires across member factories—turning private disasters into collective knowledge about which wiring practices were safe and which ones burned buildings down. Electricians were shocking themselves to death at rates as high as one in two.1 Insurance actuaries were observing enough failures to finally price electrical fire risk. By 1920, this hard-won knowledge had been codified into the National Electrical Code, making internal factory wiring economically viable—and safe—for the first time.
The productivity gains didn’t come from the electric motors themselves. Nor was the delay due to organisational learning. They came from the networks—and from the 30-year process of building the commercial infrastructure that made those networks viable.
Think of the commercial infrastructure as a grammar,2 a shared instruction manual that lets insurers underwrite, lenders price, and engineers build without needing to work from first principles each time. Shared coordination infrastructure that made installation and operation cheap and affordable, so that the productivity boost that attracted early adopters could spread to all, and so appear in national, aggregate productivity figures.
What We Actually Measured
When economists look at historical electrification data, they see (and count) electric motors. Motors appear in factories throughout the 1890s, 1900s, and 1910s. Productivity stays relatively flat. Then, in the 1920s, they see both reorganisation and a productivity boom happening together. The natural inference: firms finally figured out that reorganisation was valuable.
But electric motors are just transducers—devices that convert electrical power to or from mechanical power at the edge of an electrical distribution network. A motor is just a door; the network is the hallway. You can’t move furniture through a house until the hallways are built, no matter how many doors you install.
Motors are the least thermodynamically interesting part of the system—an appendage on the larger power network. Counting a motor tells you that electrical power distribution has reached a location. It doesn’t tell you anything about the network architecture that’s actually providing the efficiency gains.
The Thermodynamic Reality
Electrification didn’t eliminate the steam engine. It moved it.
Instead of every factory running its own small, inefficient steam engine, centralised utilities ran large, efficient steam engines and distributed the power electrically. The electric motor at the factory was just a transducer converting electrical power back to mechanical power. The utility used generators (transducers in the opposite direction)3 to convert mechanical power from the steam engine to electrical power for distribution.
The efficiency gains came from three network-architecture benefits:
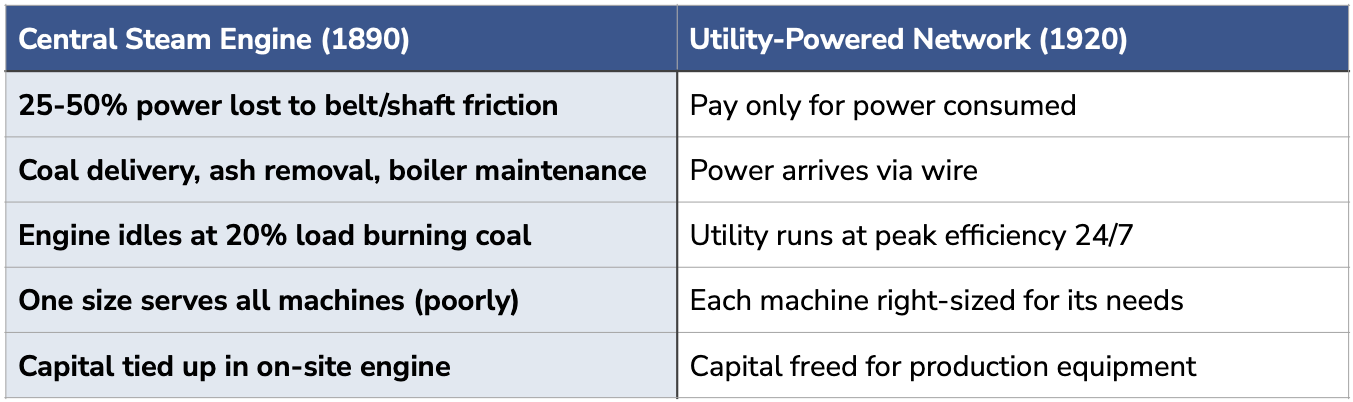
Scale economies in steam generation: Large steam engines at utility scale are inherently more thermodynamically efficient than small factory engines. Better heat recovery, better maintenance, better capital amortisation.4 Large engines can afford the ‘weight and space penalty’ of extra equipment that squeezes more energy out of the steam.5
Power on demand: No losses when machines are idle. With a central factory steam engine, you lose energy maintaining steam pressure even when the factory is partially idle. With electrical distribution, you pay only for power actually consumed.
Right-sizing: Each machine can have exactly the power capacity it needs, rather than being constrained by the capacity of the central shaft system.
A factory’s 50hp steam engine might idle at 20% load most of the day, burning coal just to stay warm.6 A utility’s 500hp engine runs near peak efficiency 24/7, and the factory only pays for the electrons it actually uses.
The benefits come from the network architecture, not from the transducers at its edges.
The Two Network Phases
The story has two distinct phases, driven by two distinct network architectures.
Phase 1 (1890s): External Distribution Networks
Newly formed electric utilities began selling power to factories in the 1890s. At first this was for electric lighting (to expand operating hours), but it was soon realised that mechanical power was a bigger opportunity. Factories replaced their on-site steam engines with utility power, hooking their existing belt-drive systems to electric motors instead. This delivered immediate, substantial gains—roughly 20% fuel savings, and the elimination of coal and water logistics—from centralising steam generation at utility scale.
These external networks deployed quickly because the economics were straightforward. The gains came from network architecture (centralised generation plus electrical distribution to factory boundary), not from anything special about electric motors. Motor counts from this period simply track the penetration of external electrical distribution.
Phase 2 (1900s-1920s): Internal Distribution Networks
The real revolution—the one that enabled factory reorganisation and delivered the 1920s productivity boom—required internal electrical distribution networks. This meant wiring throughout the factory to deliver power directly to individual machines, eliminating the belt-and-shaft transmission system entirely.
This delivered the same three thermodynamic benefits, but now applied internally:
Better sizing (each machine gets exactly the power it needs)
Power on demand (no transmission losses when sections are idle)7
Elimination of 20-30% mechanical transmission losses in belts and shafts
But internal distribution didn’t become economically viable for most firms until the 1900s-1920s. Not because firms were slow to realise its value, but because the commercial infrastructure required to make internal distribution cheap and safe enough didn’t exist yet. Yes, factories are often slow to reorganise, but electrification shows what happens when the constraint isn’t organisational learning—it’s infrastructure.
Phase 1 gains, while real for individual factories, didn’t show up immediately in aggregate productivity statistics due to ongoing costs and disruptions of industrial expansion, the shift from water to steam power in some regions, and the massive investments in the electrical grammar itself. The Phase 2 boom represented the networked multiplication of these gains across a now-mature infrastructure.
From Tacit to Codified
Between the 1890s and 1920s, something crucial was happening: the accumulation of knowledge about how to safely and cheaply distribute electricity inside buildings.
This ‘grammar’ included:
Electrical codes and safety standards
Understood best practices for industrial wiring
Insurance products that could price electrical fire risk
Residual value tables for electrical equipment
Standardised components and installation practices
Training programs for electricians
This wasn’t knowledge firms could generate on their own. It required failure data from thousands of installations. It required insurance actuaries to observe enough fires to price policies accurately. It required electricians to train on enough projects to become efficient. It required equipment manufacturers to standardise on designs that worked reliably.
The external distribution networks deployed in the 1890s provided the testing ground. As firms wired buildings and accumulated operational experience—transitioning from drop-in replacement through group to unit drive—the broader knowledge base matured, costs dropped and safety improved.
The Mutual Insurance Mechanism
Factory Mutual Fire Insurance Company provides a concrete example of how this grammar-building worked. Factory Mutual operated on the principle of mutuality: member factories insured one another’s losses, dividing aggregate losses ex post rather than paying fixed premiums ex ante. This created powerful incentives for the collective to develop and enforce safety standards.
Factory Mutual couldn’t simply price electrical fire risk—they worked to prevent it. They commissioned detailed surveys of member facilities, accumulating systematic data on what wiring practices caused fires and what practices prevented them. They then enforced requirements to keep all members at the same safety standards, because each member was literally insuring the others’ losses.
This mutual structure transformed electrical failures from private disasters into collective learning events. Every electrical fire at a member factory generated data that improved the standards for all members. The knowledge accumulated through this process—which practices were safe, which materials were reliable, which installation methods prevented failures—became codified in the requirements Factory Mutual enforced.
This is grammar-building in action: private failures generating public knowledge, which then gets embedded in standards that reduce the cost and risk of deployment for everyone. The mutual insurance structure internalised the externality of learning-by-failure, accelerating the maturation of the commercial infrastructure.
This institutional learning directly translated into measurable cost declines.
Knowledge Transformation
The grammar-building process can be understood as a transformation in where electrical knowledge lived.
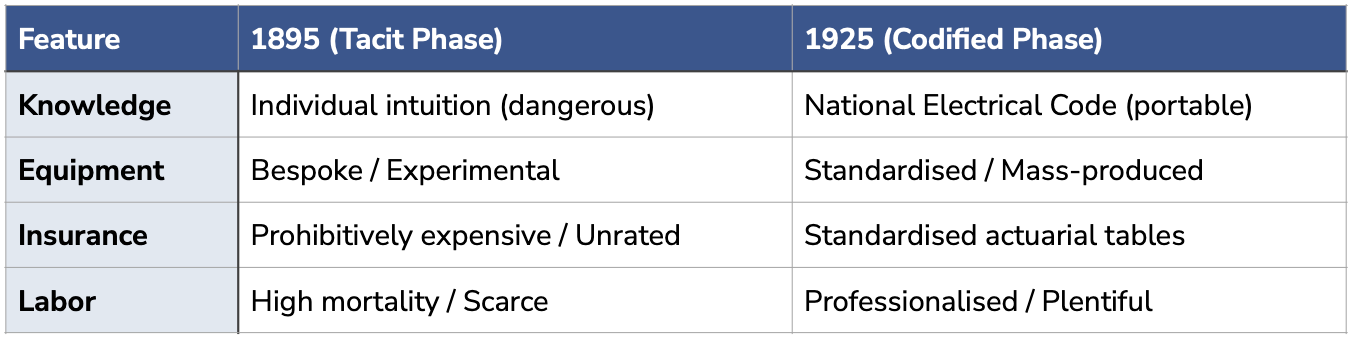
1890s: Tacit knowledge in individual electricians
Electrical knowledge existed in the hands of electricians who learned by shocking themselves. This was private, embodied knowledge—dangerous to acquire, impossible to transfer efficiently, and lost when the electrician died or changed jobs. Each new electrician paid the full cost of learning from scratch.
1910s: Institutional knowledge in survey reports
Organisations like Factory Mutual transformed this tacit knowledge into institutional knowledge. Their detailed facility surveys turned private failures into collective data. Which wiring configurations caused fires? Which materials degraded? Which installation methods prevented failures? This knowledge now lived in Factory Mutual’s reports and enforcement requirements—still somewhat proprietary, but shared across member firms.
1920s: Codified knowledge in the NEC
By 1920, this institutional knowledge had been distilled into the National Electrical Code8—a publicly available codebook that made electrical knowledge portable and cheap to acquire. Any electrician could buy the NEC, any building inspector could enforce it, any manufacturer could design to it. The knowledge had become a public good.
This transformation is what made internal electrical power distribution economically viable. In 1895, deploying internal distribution required hiring scarce electricians with hard-won tacit knowledge, paying premium prices for their expertise, and accepting high failure risk because best practices hadn’t been discovered yet. By 1920, you could hire code-trained electricians at standard rates, buy standardised equipment, follow published standards, and get affordable insurance—because the knowledge had been systematised and made public.
The Empirical Evidence
We can trace this grammar-building directly through three cost dimensions: installation prices, insurance premiums, and electrician training. In each case, the pattern is the same—high costs and high risk giving way to standardised, affordable practices as knowledge moved from tacit to codified.
Installation Costs: Expensive, fire-prone knob-and-tube system that was viable in 1909 got replaced by safer, code-compliant alternatives that became affordable by the 1920s. In 1909, professional-grade conduit installation cost about three times as much as cheap knob-and-tube wiring.9 By 1923, that premium had fallen to 2.5x: knob-and-tube systems cost index 40 while rigid conduit systems cost index 100, with absolute costs for both falling as the supply chain matured.10 The grammar didn’t just reduce costs—it transformed the quality-adjusted price of safe internal distribution.
Insurance and Fire Risk: The insurance industry couldn’t simply price electrical fire risk—they had to systematically reduce it. In 1906, fire losses in America totalled nearly $520 million (over $18.4 billion in current dollars), and the industry recognised that electrification posed new hazards. In response, the National Board of Fire Underwriters convened insurance electric light inspectors in 1892 to lay the groundwork for an electrical code covering wiring and lighting. By the early 1920s, nearly thirty states had adopted rate regulation requiring uniform statistics on premiums and losses, indicating that electrical fire risk had become standardised and actuarially predictable—a dramatic shift from the uncertain, uninsurable hazard of the 1890s.
Labor Training and Efficiency: There were no apprenticeship standards, no industry-wide safety training, and electricians learned primarily through dangerous trial and error. The formation of the International Brotherhood of Electrical Workers (IBEW) in 1891 marked the beginning of systematic change.11 By the late 1890s, many IBEW local unions had initiated informal apprenticeship programs, and in 1900, the IBEW convention officially called for the establishment of formal, standardised apprenticeship programs. By 1923, formal apprenticeship programs were being established at local unions, combining classroom instruction with on-the-job training.12 This professionalisation dramatically improved installer efficiency.
Regulatory Infrastructure: The National Electrical Code was first published in 1897, providing initial standards.13 The 1911 NEC edition introduced electrical inspections to ensure installations remained up to code, transforming electrical installation from an unregulated craft into a systematically inspected practice. The National Electrical Safety Code, developed by the National Bureau of Standards starting in 1913, brought consistency to electrical supply and communications systems nationwide.
What changed the cost structure? Learning curves in the supply chain:
Insurance actuaries learning to price fire risk (1892-1920s)
Equipment manufacturers standardising designs (porcelain tubes, junction boxes, conduit fittings)14
Training programs producing efficient electricians (1891-1923)
Standards bodies codifying best practices (NEC 1897, NESC 1913)
Municipal inspection regimes institutionalising compliance (1911+)
Once this supply-chain learning crystallised into price lists, actuarial tables, code books, and training curricula, any factory could adopt internal distribution quickly. The delay was upstream, not on the shop floor.
Why This Matters: The Measurement Problem
Motor counts tell us about distribution penetration, but if we want to understand why productivity changed when it did, we need to look at what made internal distribution economically viable.
In 1923, detailed cost breakdowns showed that knob-and-tube internal wiring (the cheapest option) cost index 40, while rigid conduit cost index 100.15 The motors themselves were identical across both systems. What you’re paying 2.5x more for is:
Conduit, switchgear, and proper grounding systems
Porcelain tubes, junction boxes, and standardised fittings
Trained labor that knows how to install it safely
Insurance that will cover you if it fails
None of this shows up in capital stock series that count motors.
The methodological principle:
The unit of analysis should be where the thermodynamic benefit emerges from, not the easiest thing to count.
Counting motors to measure electrification productivity is like counting thermometers to measure whether you’ve insulated your house. The thermometer reading changes, but the thermometer isn’t the source of the change. Motors tell you electricity is present, not where the efficiency gains originate.
This case shows why it’s worth asking: where does the efficiency actually come from? Often it’s network architecture rather than the countable artefacts at the edges. The capital that matters—conduit, switchgear, trained electricians, insurance frameworks, safety standards—is largely invisible to these measurement approaches.
Reorganisation as Evidence, Not Explanation
The standard story treats workflow reorganisation as the cause of productivity gains—something firms slowly learned to do. But the actual pattern of adoption proves the opposite.
Workflow reorganisation was the result, not the cause. Once internal wiring became affordable, factory owners immediately rearranged machines to capture the network’s benefits. The 20-year gap wasn’t learning what to do—it was waiting for the grammar that made doing it cheap enough.
Warren Devine’s detailed study of factory electrification shows three distinct stages.16 First, factories kept their belt-and-shaft systems but powered them with electric motors instead of steam engines (1890s). Next they developed group drive—one motor powering clusters of related machines (1900s-1910s). Finally they moved to unit drive—individual motors for each machine—and reorganised the factory floor entirely (1910s-1920s).
The key insight: firms moved through these stages as fast as the economics allowed. There was no learning delay. The moment group drive became affordable, firms adopted it. The moment unit drive became affordable, they reorganised around it. Each transition happened immediately once the commercial infrastructure made it viable.
The progression itself reveals the constraint. With belt-and-shaft systems, you were physically imprisoned—machines had to be placed where the shaft reached, not where the workflow made sense. Group drive partially freed you but still required machines to cluster around motors. Only unit drive eliminated spatial constraints entirely, allowing you to:
Place machines to optimise work flow between machines rather than power flow to machines
Right-size power to each machine instead of running everything off shared capacity
Shut down sections without wasting power on transmission losses
Eliminate 20-30% of mechanical transmission losses from belts and shafts
These aren’t insights firms slowly discovered. They’re immediate consequences of removing physical constraints. And firms captured them the moment the constraints were removed.
The 30-year puzzle isn’t ’why did it take firms so long to reorganise?’ It’s ’why did it take 30 years to progress from group drive to affordable unit drive?’ The answer is grammar-building: the codes, insurance products, training programs, and standardised equipment that made safe, cheap internal wiring viable at scale.
Implications
1. Motors are markers, not causes
Total Factor Productivity (TFP, a measure of economic efficiency) series count motors because they can be inventoried. But the marginal dollar of capital that unlocked the 1920s productivity spike was embedded in conduit, switchgear, trained electricians, and fire-insurance riders—none of which show up in ‘capital stock’ series.
2. Learning curves sit in the supply chain, not the factory
The relevant learning was electricians learning, insurers learning, equipment makers learning. Once that learning crystallised into price lists and code books, factories could adopt almost overnight. The delay was upstream, not on the shop floor.
3. ‘Complementary capital’ is mis-located
We assume complementary investments are something the user has to accumulate (concrete foundations, reconfigured workflow). But the binding constraint was in the network layer—and those complementarities were accumulated by the electrical contractor and insurance industries, not by downstream manufacturing firms.
The Larger Pattern
The electrification story reveals a general principle about technology adoption: when you see a multi-decade gap between initial adoption and widespread productivity gains, look for the grammar-building period. Look for what commercial infrastructure had to mature before the technology could scale.
The timeline varied by institutional context—German factories moved faster due to universal banks funding entire electrical ecosystems,17 bypassing some of the grammar lag in the fragmented US market. But the underlying pattern holds: the delay is usually in building commercial infrastructure, not in firms slowly figuring out what to do.
This matters for how we measure and understand technological change. When analysing adoption, don’t just count the artefacts at the network edge. Thermodynamic (or informational, or organisational) benefits often emerge from network architecture—from the invisible infrastructure that makes deployment safe, cheap, and economically viable.
The thirty-year delay wasn’t mysterious at all. It was exactly how long it took to build the infrastructure that made the revolution possible. When we measure motors but miss the networks, we misunderstand not just electrification, but the nature of technological change.
I publish weekly essays on how emerging technology actually changes work—not the hype, not the panic, just the patterns. Subscribe to follow along.
Want to see how the pieces connect? Check out The Framework.
‘There was no apprenticeship training, and safety standards were nonexistent. In some areas the mortality rate for linemen was one out of every two hired, and nationally the mortality rate for electrical workers was twice that of the national average for all other industries.’ See Dudley, Matthew. ‘History of the IBEW.’ Birmingham Electrical JATC, September 3, 2013. https://bejatc.org/history-of-the-ibew/.
I use ‘grammar’ here, but in economics this is often called ‘Social Capability’ or ‘Complementary Inputs.’ My use is something of a suitcase term: all the commercial infrastructure we need to make purchasing, installation, maintenance & insurance, and disposal cheap and efficient.
Electrical motors and generators are essentially the same technology, but optimised to transmit power in a particular direction. Many applications, such as pumped hydro, are hybrids that run them in both directions.
The efficiency of large steam engines stems from the square-cube law: increasing the engine’s size causes its volume (power) to grow much faster than its surface area (heat loss). Large engines retain more heat, whereas small engines bleed energy through their walls. Additionally, the massive scale of industrial engines allows for the inclusion of complex energy-recovery systems—such as multi-stage expansion cylinders, condensers that create a power-boosting vacuum, and superheaters—that are too heavy, expensive, or complex to fit onto smaller machines. The increased scale also enables easier and more professional maintenance, significantly boosting and maintaining efficiency.
Condensers lower the ‘exhaust’ pressure to a vacuum, allowing the steam to expand further and do more work, but require cooling systems and pumps that would be too heavy for a small engine. Compounding uses the exhaust from one cylinder to power a second, larger ‘low-pressure’ cylinder. This increases the number of moving parts and the physical size/weight of the engine significantly. Superheaters heat the steam beyond the boiling point so it doesn’t condense back into water inside the cylinders, but require complex plumbing and high-strength materials that are expensive at a small scale. Feedwater Heaters use ‘waste’ heat from the exhaust to pre-heat the water going into the boiler, adding significant plumbing complexity and maintenance needs.
Friction and windage losses in the transmission system could consume 25% to 50% of the total engine output before a single machine tool was even engaged.
The individual motor allowed for the intermittency of power. In a belt-drive factory, the whole line had to spin even for one machine. In a unit-drive factory, power consumption is perfectly correlated with output. The motor is the gatekeeper of this correlation, even if the network provides the efficiency.
The first National Electrical Code was published in 1897 under sponsorship of the Underwriters’ National Electrical Association. See “125 and Counting—An Important History Behind the Establishment of the NEC.” EC&M Magazine. https://www.ecmag.com/magazine/articles/article-detail/codes-standards-125-and-counting-important-history-behind-establishment-nec.
Joseph G. Branch, Electric Wiring (Chicago: Branch Publishing Co., 1910), 105-107.
Arthur L. Cook, Interior Wiring and Systems for Electric Light and Power Service (New York: John Wiley & Sons, 1923), 244.
In the early days of the IBEW, insurance companies often refused to sell life insurance to linemen and wiremen because the death rate was so high (sometimes cited as 1 in 2).
‘History,’ IBEW Local Union 309, accessed January 2026, https://www.ibew309.com/About_lu_309/.
H. C. Cushing, Standard Wiring for Electric Light and Power, 23rd ed. (New York: H. C. Cushing, Jr., 1917), 127.
LaLuce D. Mitchell, “Early Electrical Wiring Systems in American Buildings, 1890-1930,” APT Bulletin: Journal of Preservation Technology 42, no. 4 (2011): 39-45.
Arthur L. Cook, Interior Wiring and Systems for Electric Light and Power Service (New York: John Wiley & Sons, 1923), 244.
Devine documents the progression from belt-and-shaft through group drive to unit drive in American factories from 1890-1920s. See Devine, Warren D. “From Shafts to Wires: Historical Perspective on Electrification.” The Journal of Economic History 43, no. 2 (1983): 347–72. https://doi.org/10.1017/S0022050700029673.
German ‘Universal’ banks often funded the entire electrical ecosystem (generation + factory + equipment), which allowed them to bypass some of the “grammar” lag seen in the fragmented US market.
The grammar-building framework completely reorients how we should think about technology adoption timelines. I've been working in enterprise software and constantly see this same pattern - companies dunno why SaaS took off when it did, and usually peg it to "cloud maturity" without realizing the real constraint was payment infrastructure, security certifications, and compliance frameworks maturing. The mutual insurance mechanism you describe is a perfect example of how failure data gets transformed into public goods. This has huge implications for how we measure AI adoption today - counting model deployments misses the entire grammar-building layer happening right now.